

Data and analysis
Here are the essentials of two technical reports from the PiCARO project and the Instituto Tecnológico de Pabellón de Arteaga (ITPA). Every number comes from published data and from scripts that anyone can run again. This page is a summary: the details, methods and limitations are in each report.
A) Field tests · July to October 2026
Before the event there was a test campaign with two PiCARO radiosondes and three gateways: two on the ITPA campus and one in a lab in Aguascalientes, about 27 km south of ITPA. 52 capture sessions were opened; 28 were valid for the analysis.
Key findings
- Geometry matters more than distance. On a hill with line of sight, at 15.2 km, the probe delivered 92.0% of its packets (SF10, Class A). On a rooftop terrace at 2.8 km it delivered 67.9% (Class A) and 66.8% (Class C). On a drive through the city, only 25.3% (Class A) and 31.9% (Class C).
- The line of sight at 15.2 km was clear. The first Fresnel zone was clear along the whole path to the hill: the minimum margin was +23 m in the first kilometer, and the median per kilometer was 178 m.
- The free-space calculation was optimistic. On the hill, −85.8 dBm was expected and −110 dBm was measured: 24 dB less.
- The spreading factor (SF) matters. On the terrace, with SF7, the signal arrived right at the limit (+0.2 dB of margin). At the same site, with SF10, there were +10 dB to spare.
- In Class A, a command waits for the next uplink. On the hill it took a median of 9.6 s (theory gave 9.0 s). With a degraded link (47% delivery), the median rose to 46.2 s and the worst case to 226.9 s.
- Class C delivered commands, but its latency was not measured in the campaign. With the class correctly aligned on the server, both classes delivered commands. Before August 29, 7 of 14 sessions ran with the class mismatched, and in that case no command arrived.
Figures
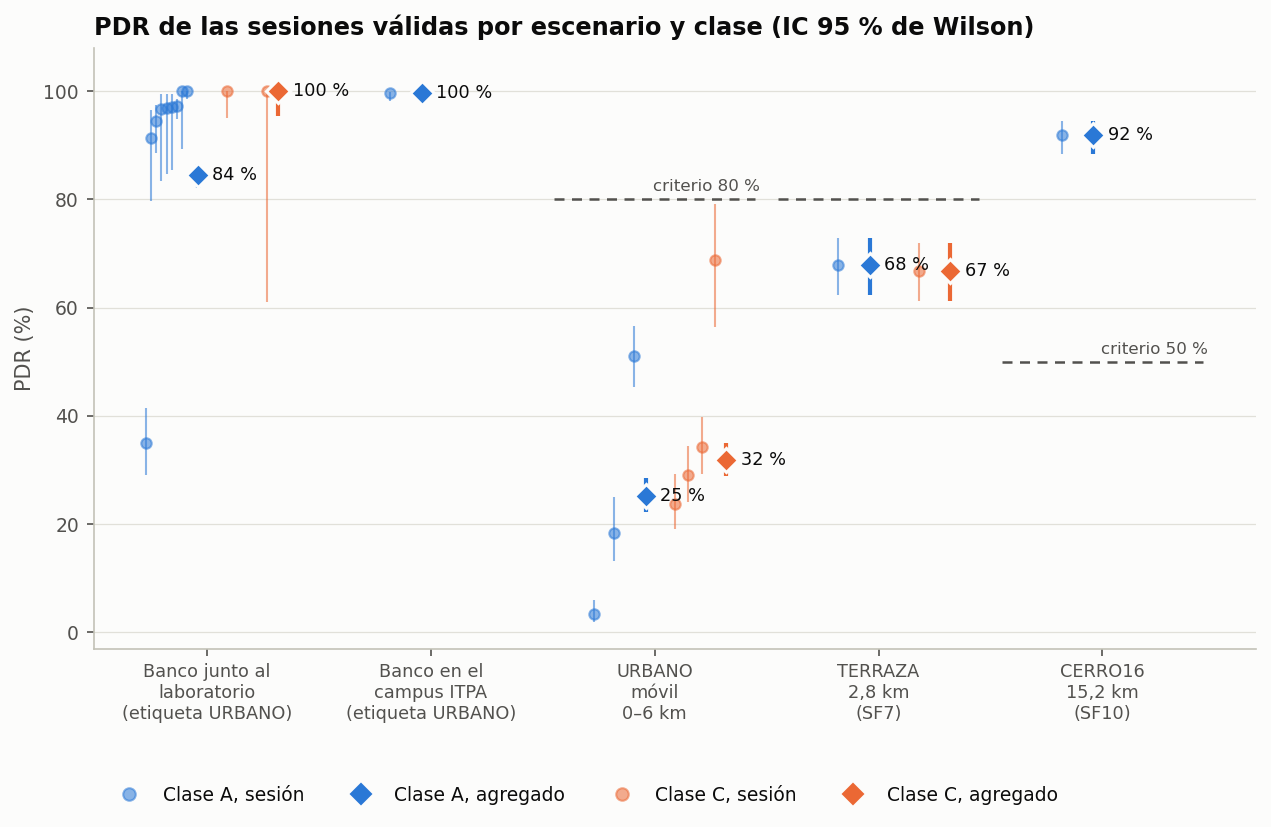
Packet delivery ratio (PDR) by scenario and class, with its confidence interval.
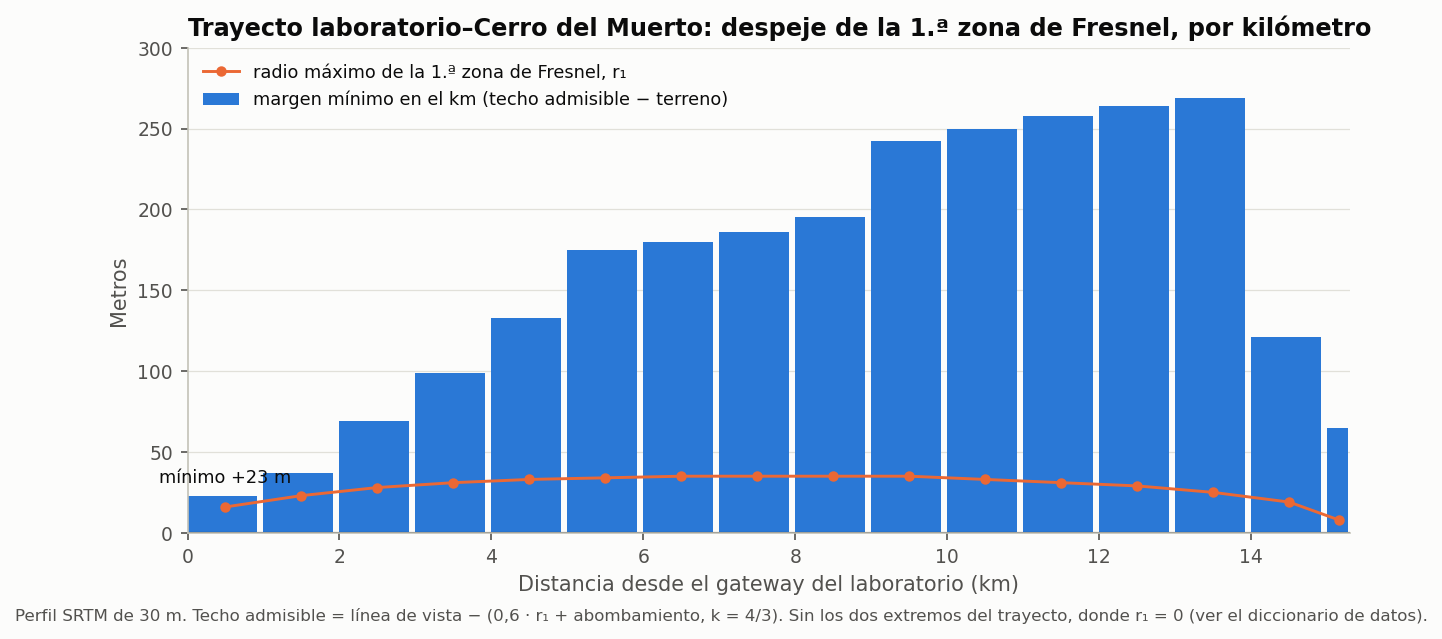
First Fresnel zone clearance, kilometer by kilometer, along the 15.2 km path to the hill.
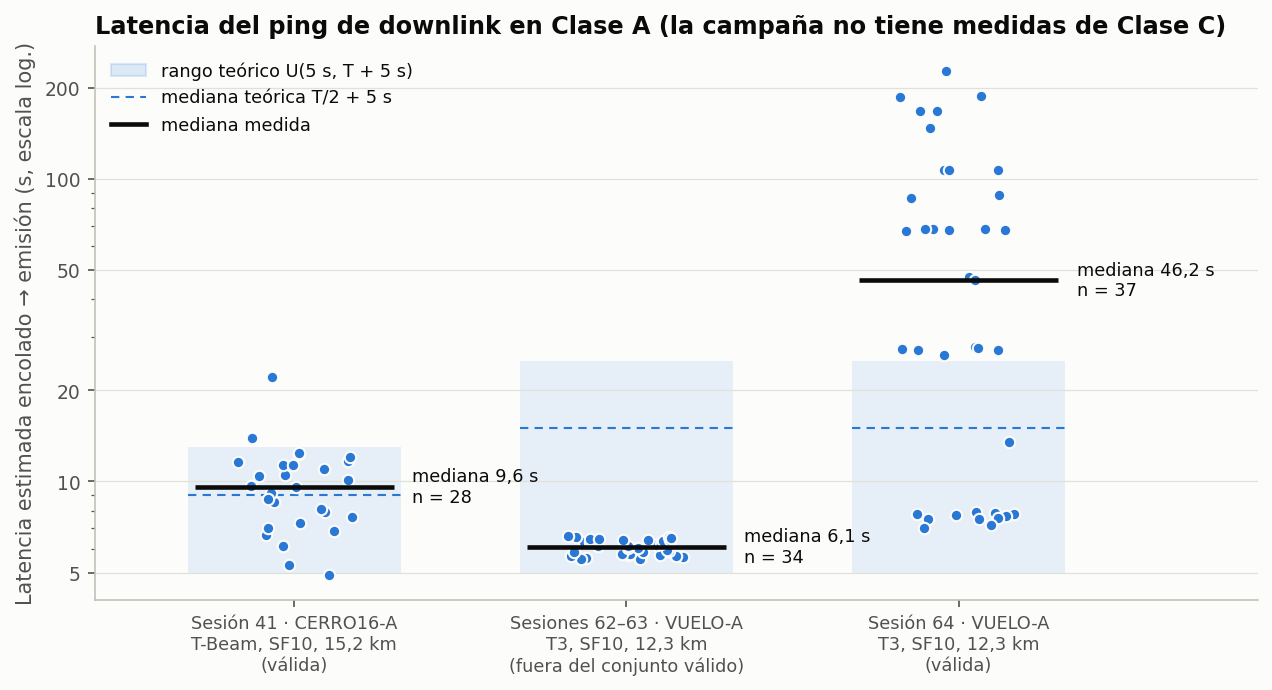
Estimated latency of each command in Class A, compared with the theoretical model.
Full report: Field tests of the PiCARO radiosonde over LoRaWAN (US915) · folder with data and scripts
The original, non-anonymized data can be requested through https://pi-caro.org.
B) Competition analysis · SatLink 2026
The flights on the night of October 28, 2026: the Orbitium (Sci-Fi) probe, from the Instituto Tecnológico de Pabellón de Arteaga (ITPA), and the TAES probe, from Instituto Tepeyac and the Universidad Politécnica de Aguascalientes (UPA).
Key findings
- Flight profile. Orbitium reached 8,478 m and TAES 5,065 m. The 8,478 m was validated with two different GPS receivers: at the same pressure, the two probes differ by only 11 and 17 m.
- They rose more slowly than expected. From the ground to their maximum altitude they averaged 2.49 m/s (Orbitium) and 1.86 m/s (TAES). The design assumed about 5 m/s. At 2.49 m/s, reaching 15 km takes ~88 min.
- Atmosphere. From the TAES data, the estimated air temperature was about 15-17 K above the International Standard Atmosphere (ISA) between 2.5 and 5 km, as expected at 22° N. The wind came from the south and reached 14.3 m/s at 4.9-5.4 km. Neither probe measured the outside air: the sensors were inside the capsule.
- Link. The network received 95.9% (Orbitium, SF10) and 94.3% (TAES, SF7) of the flight uplinks. But the real margin was between 26 and 40 dB below what was predicted. With three gateways, the loss dropped to less than half: from 9.2% to 4.1% and from 12.6% to 5.7%.
- Zenith null: no conclusion. Loss grows with elevation: ~23-25 dB below 10° and 36-39 dB above 35°. This is consistent with a null near the zenith, but the elevation never went above 53.3°, so no conclusion can be drawn.
- Operations. Orbitium, in Class C, answered 48 of 50 commands, with a median of 0.8 s. The downlink was the most fragile link: two commands arrived with an SNR of −20 dB or less, at 10.6 and 20.4 km. TAES lost 22 min to 17 rejected joins before the flight.
Figures
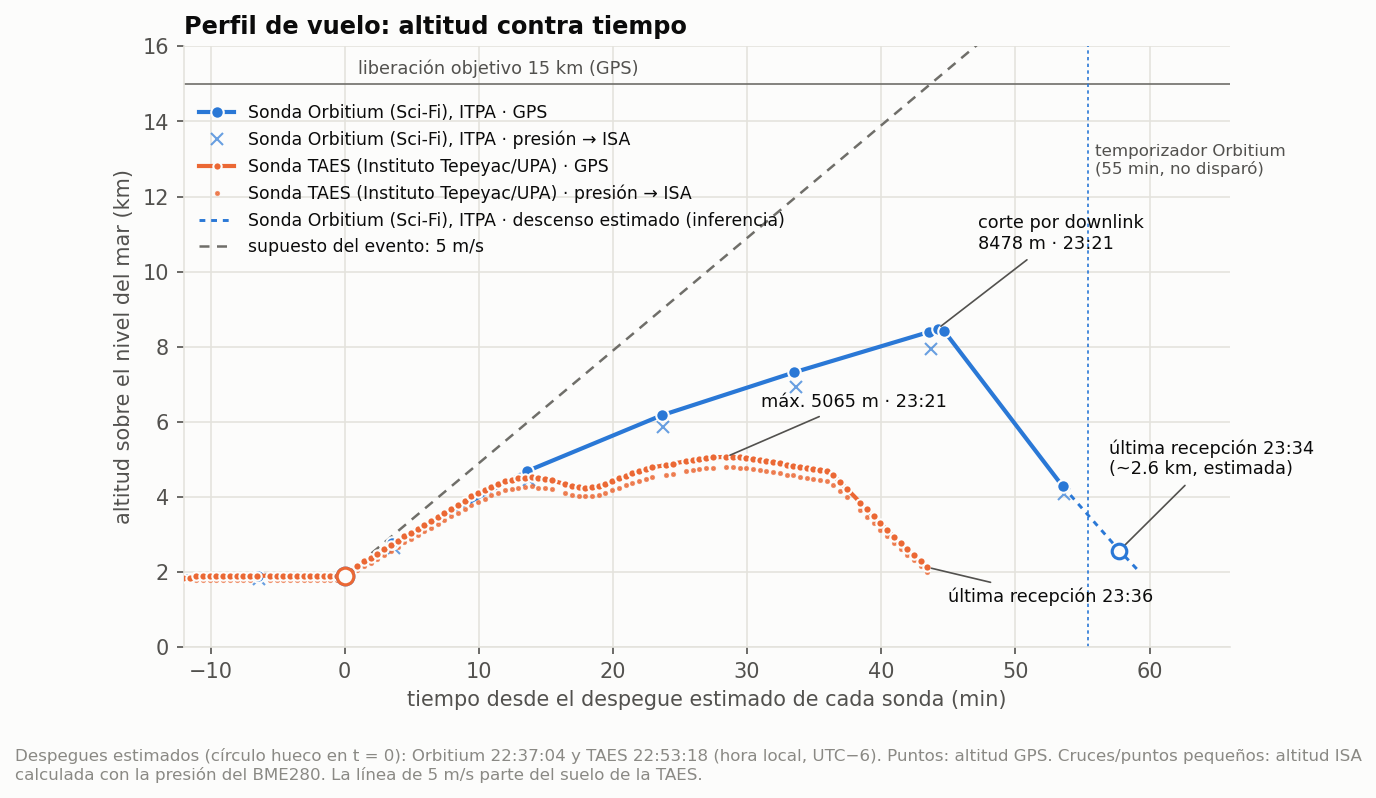
GPS altitude of the two probes over time.
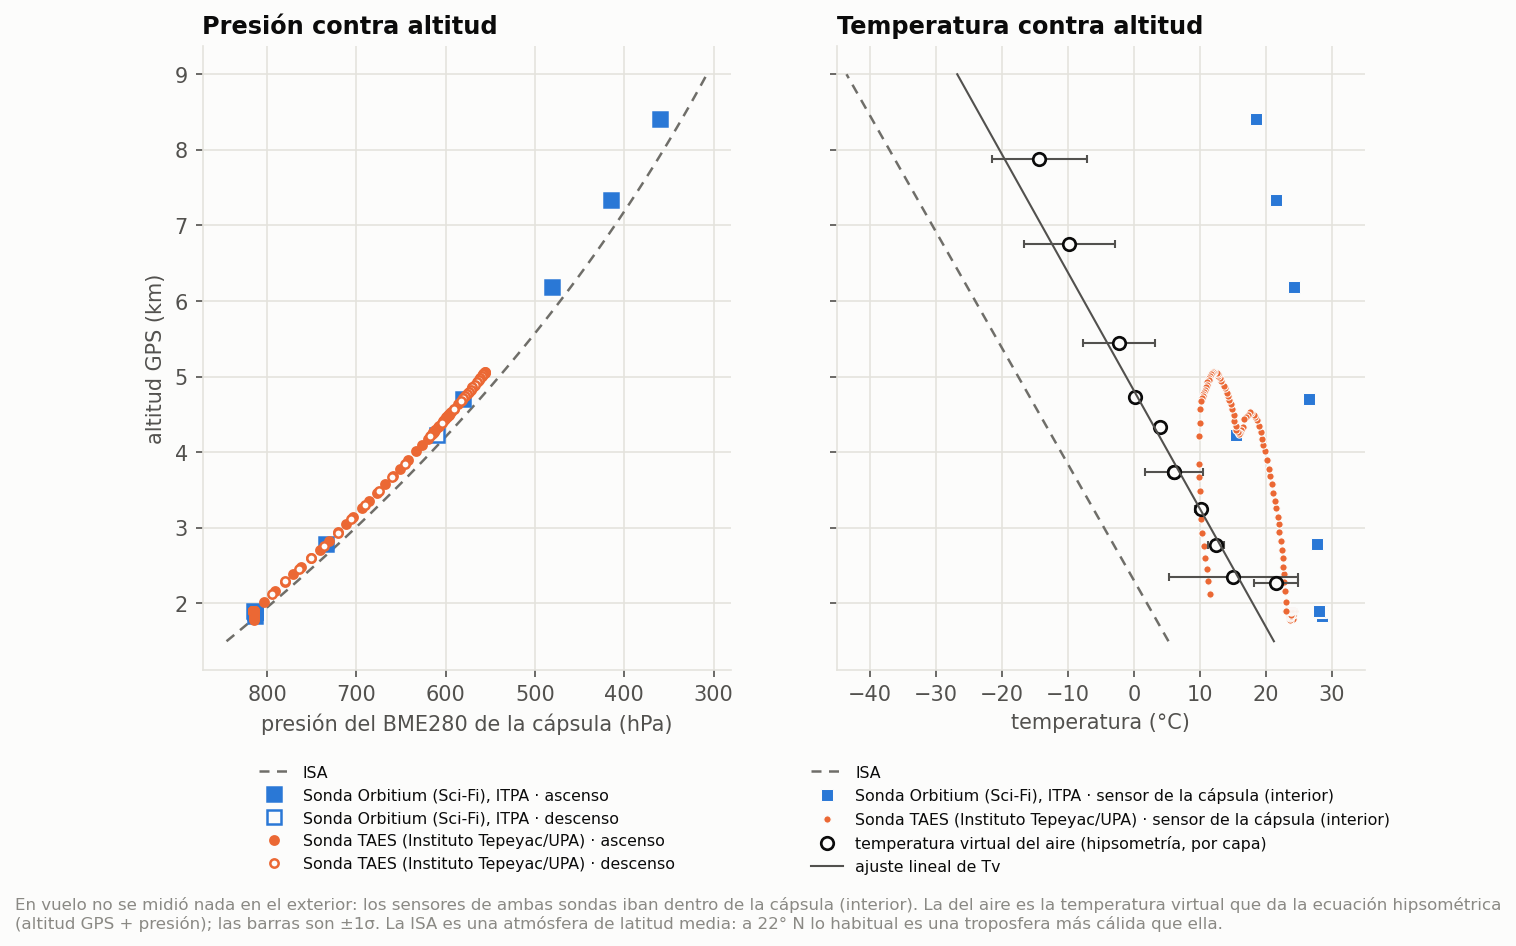
Measured pressure and estimated air temperature compared with the ISA, alongside the temperature of the sensor inside the capsule.
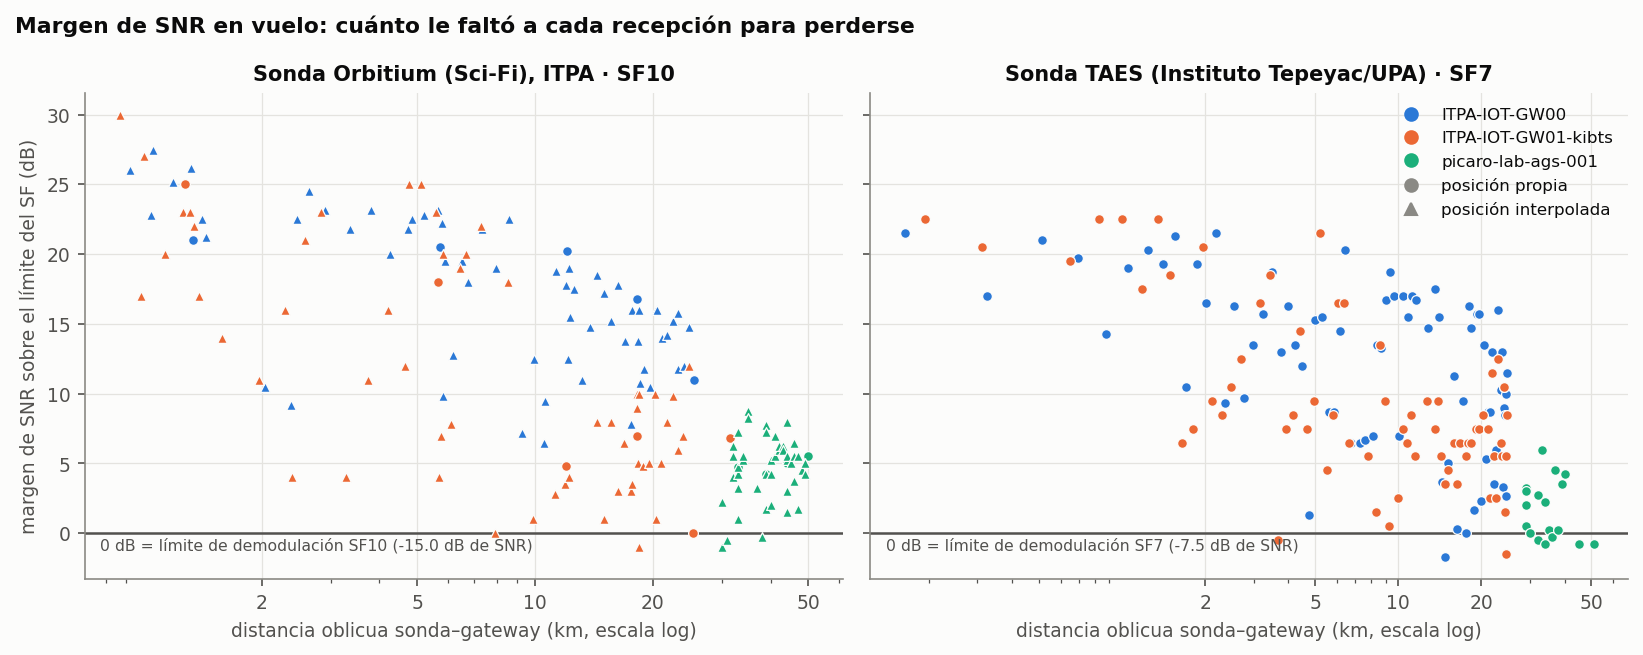
SNR margin of each in-flight reception versus distance. Zero is the demodulation limit.
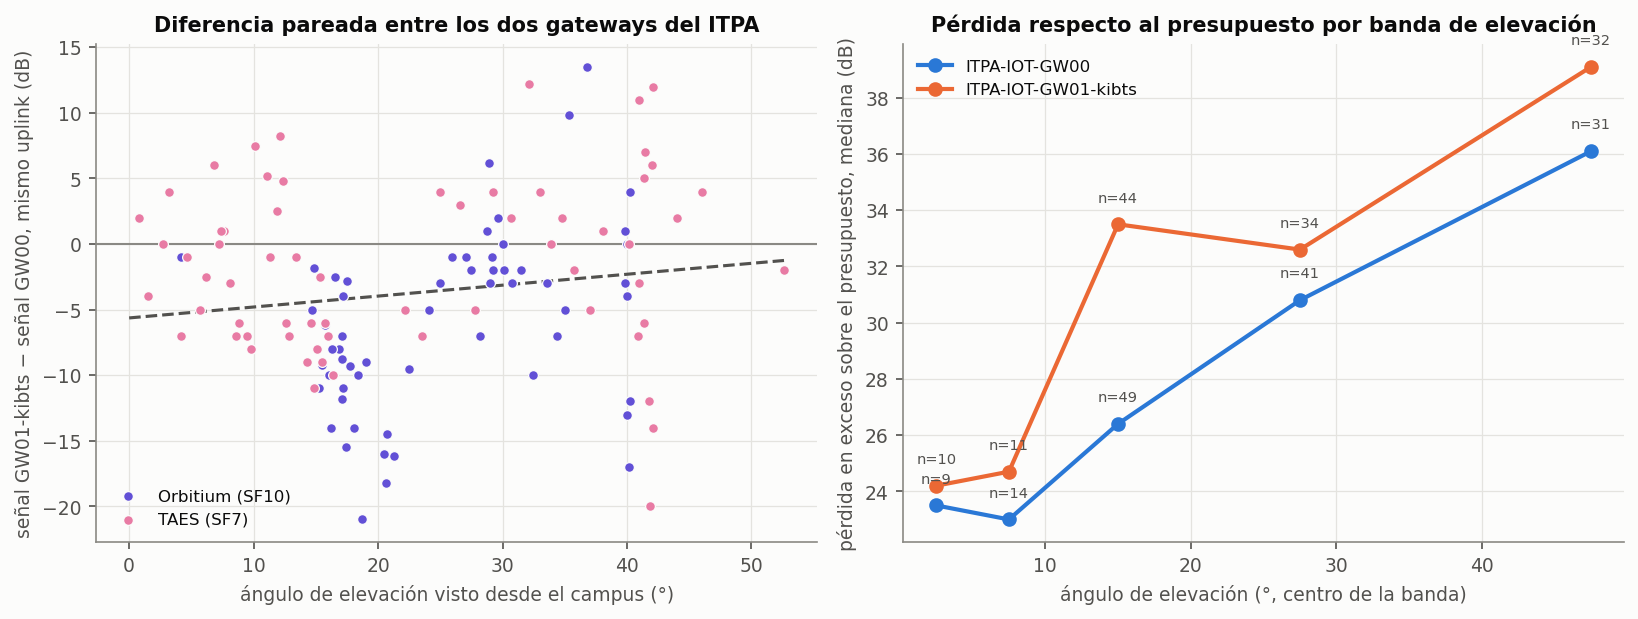
Signal difference between the two campus gateways on the same uplink, and excess loss by elevation band.
Full report: SatLink 2026: technical report on the flights · folder with data and scripts
The original, non-anonymized data can be requested through https://pi-caro.org.
Lessons carried into 2027
- Class C for commands. In Class C, Orbitium responded with a median of 0.8 s. In Class A, a command took 9.6 s on the hill and up to 226.9 s with the degraded link. TAES, in Class A, has no commands recorded on the network.
- At 15 km, line of sight. With the first Fresnel zone clear, the hill at 15.2 km delivered 92.0%. Without line of sight, in the city, delivery dropped to 25.3%.
- Design for the real ascent rate. The balloons rose at 1.9-2.5 m/s on average, not the 5 m/s assumed. At 2.49 m/s, 15 km is ~88 min after liftoff.
- Timed cutdown as a backup. The TAES timer fired at ~36 min, at ~4.7 km. It is also worth transmitting an explicit release event: Orbitium's left the cutdown documented second by second.
- More link margin. The real margin was 26-40 dB below the prediction in flight, and 24 dB on the ground. Each probe's transmit power and antenna need to be measured.
- Several gateways. With three, the loss dropped to less than half.